# Boosting Your React App Performance with React Profiler
Published 2021-12-17 · https://www.justjeb.com/post/react-profiler
A detailed guide to measuring and improving your React App performance with React Profiler. Accompanied by a web app that makes it easy to follow along.
Writing a React application is easy.
Writing a good React application is more complicated.
Writing a good React application that also works fast, well, this takes a lot more than just programming skills.
Even if you're a great programmer, sharp as a tack, smart as a whip, as good with React as Dan Abramov - you miss stuff; it happens. And sometimes it's not trivial at all to find out what it is that you've missed.
Today we're going to talk about the ultimate tool for tackling React performance issues - React Profiler.
## Background
First [introduced](https://legacy.reactjs.org/blog/2018/09/10/introducing-the-react-profiler.html) in 2018 React Profiler has been a part of [React Dev Tools Chrome extension](https://chrome.google.com/webstore/detail/react-developer-tools/fmkadmapgofadopljbjfkapdkoienihi?hl=en) for a while. You'd expect from such a powerful tool to gain a lot of popularity over the years, but I keep seeing people in the professional community using **console.log** for counting the amount of renders and measuring rendering time.
Whether it is because people are unfamiliar with the Profiler, or because it seems too complicated to them - we're going to tackle both; you're going to learn what it is and how to use it and you'll see it's not complicated at all.
So let's jump right into it.
## Lab rat
In order to showcase React Profiler we'll have a very simple application with an auto generated list of numbers which can be filtered by a search term we'll enter in a text box.
Here we go:
```tsx
const items = Array.from({ length: 200 }, () => `${chance.integer()}`);
export const FilterableList = () => {
const [searchTerm, setSearchTerm] = useState('');
return
item.includes(searchTerm))} />
}
```
Nothing complicated here they said, self explanatory code they said.
If you're at a desktop, I made this app available online [here](https://react-profiler-lab-rat.netlify.app/): open it, open DevTools and follow along with this article. If you're not, the screenshots below show every step, and further down you'll get to play with the list right here in the post.
The full code of the app can be found on [Github](https://github.com/just-jeb/react-profiler-lab-rat-app/tree/not-optimized).
## React Profiler
Now that we have our app up and running we can actually meet the React Profiler. I assume by now you already have the React Dev Tools extension installed but if not please head to the store for [Chrome](https://chromewebstore.google.com/detail/react-developer-tools/fmkadmapgofadopljbjfkapdkoienihi), [Firefox](https://addons.mozilla.org/en-US/firefox/addon/react-devtools/) or [Edge](https://microsoftedge.microsoft.com/addons/detail/react-developer-tools/gpphkfbcpidddadnkolkpfckpihlkkil) and do yourself a favor.
Once installed, React Dev Tools will be enabled on any website built with React.
Go to our web app and open Chrome Dev Tools. You'll notice that one of the tabs will be **Profiler**:
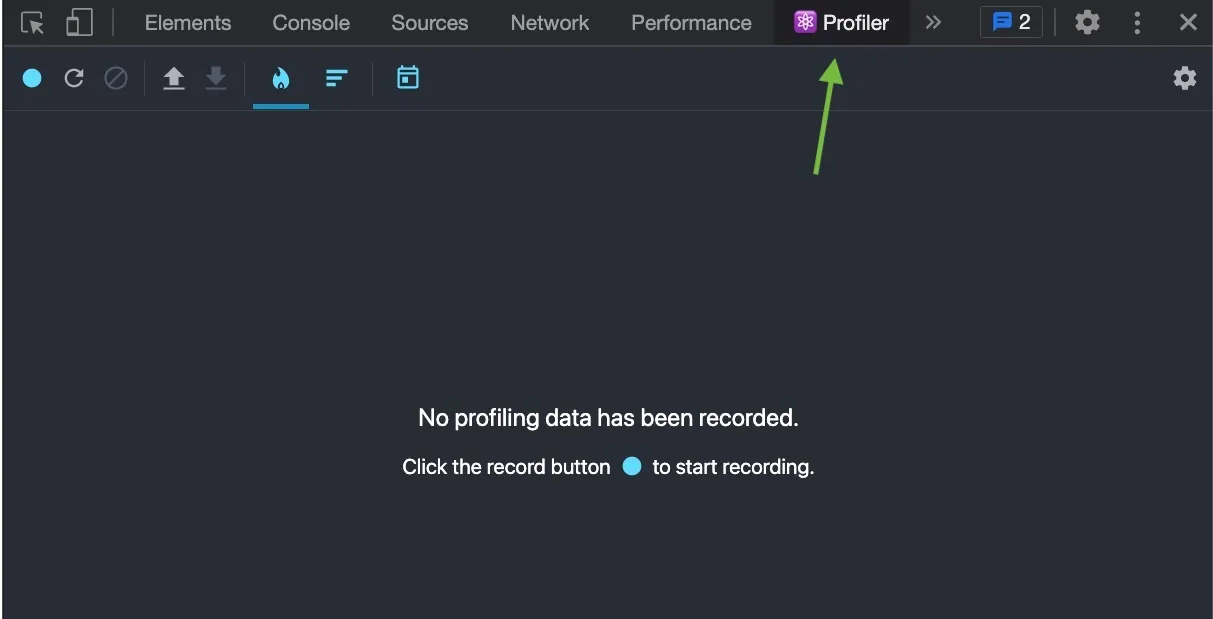
Profiling doesn't work on the fly - first you have to record a profiling session and then you can analyze it.
Before we start recording we need to enable one important setting in React Dev Tools settings:
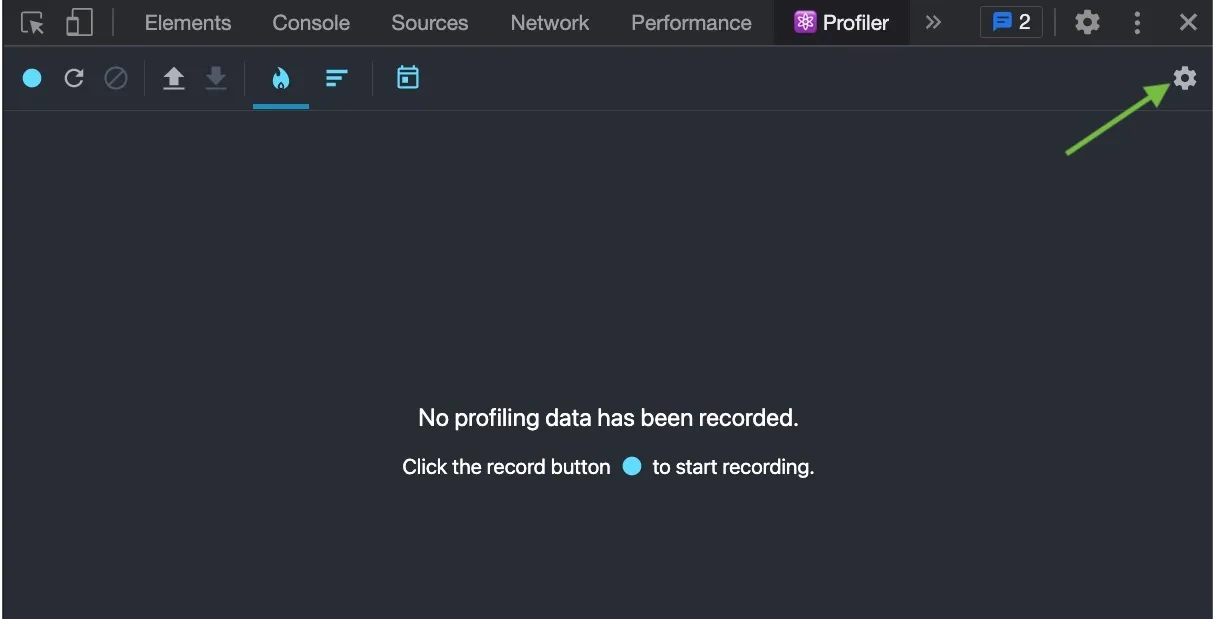
Click on the gears icon and check the **Record why each component rendered while profiling** checkbox:
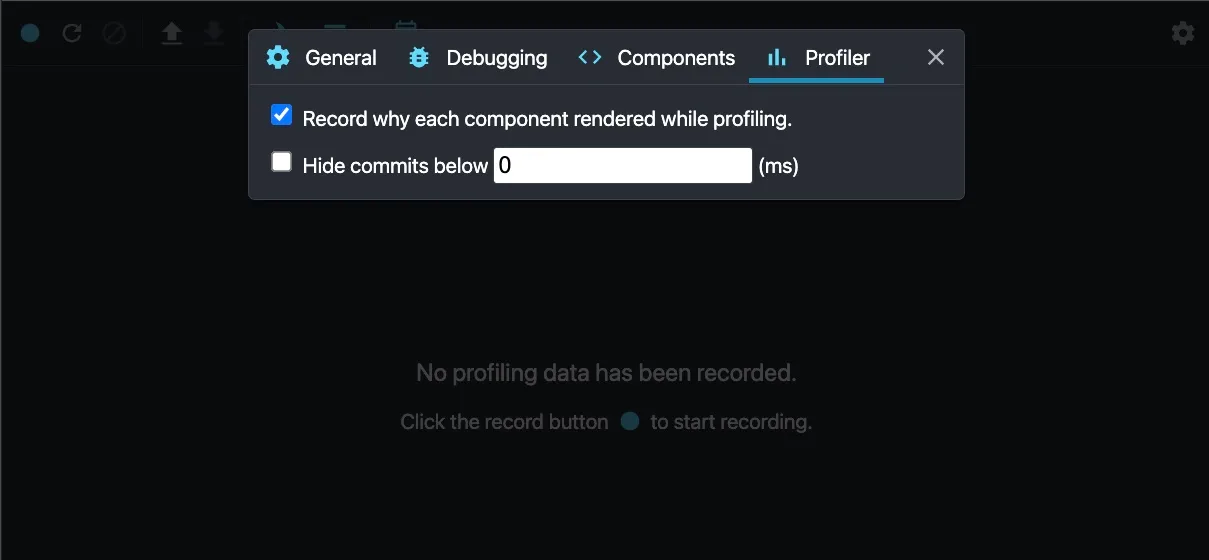
The second option (**Hide commits below**) is also useful, particularly when you have lots of [commits](https://www.justjeb.com/post/react-profiler#commits) and want to filter the insignificant ones (those that are below a certain threshold).
## Recording a profile
In order to start recording a profile click on the blue **Record** button:
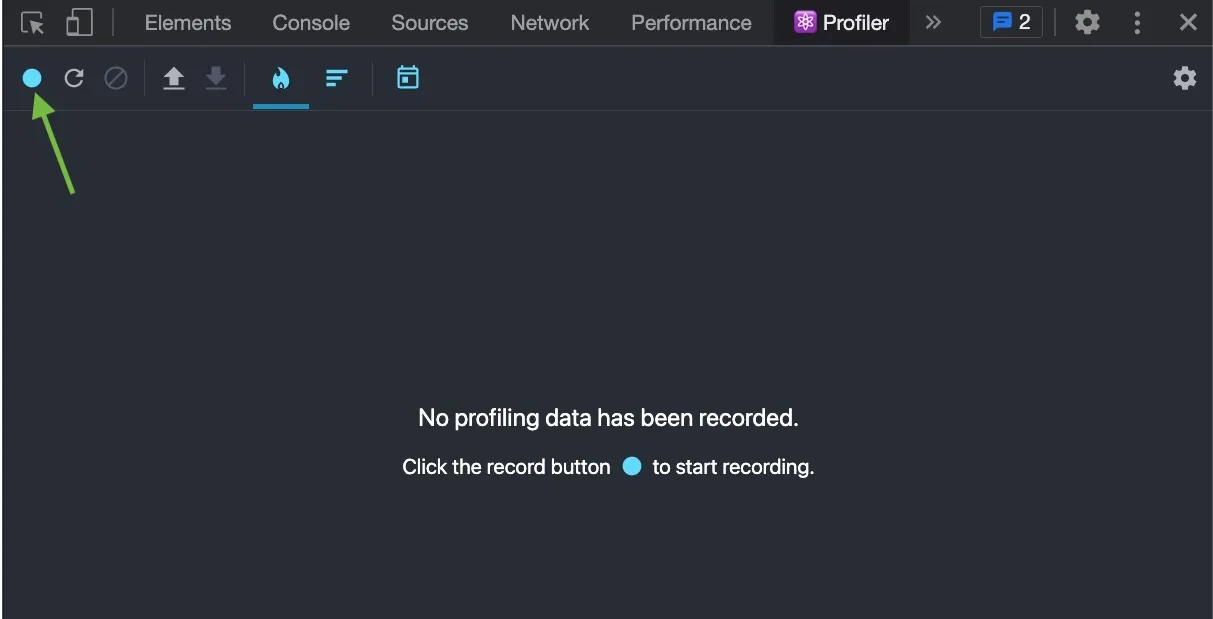
Alternatively you can reload the page and start the recording immediately:
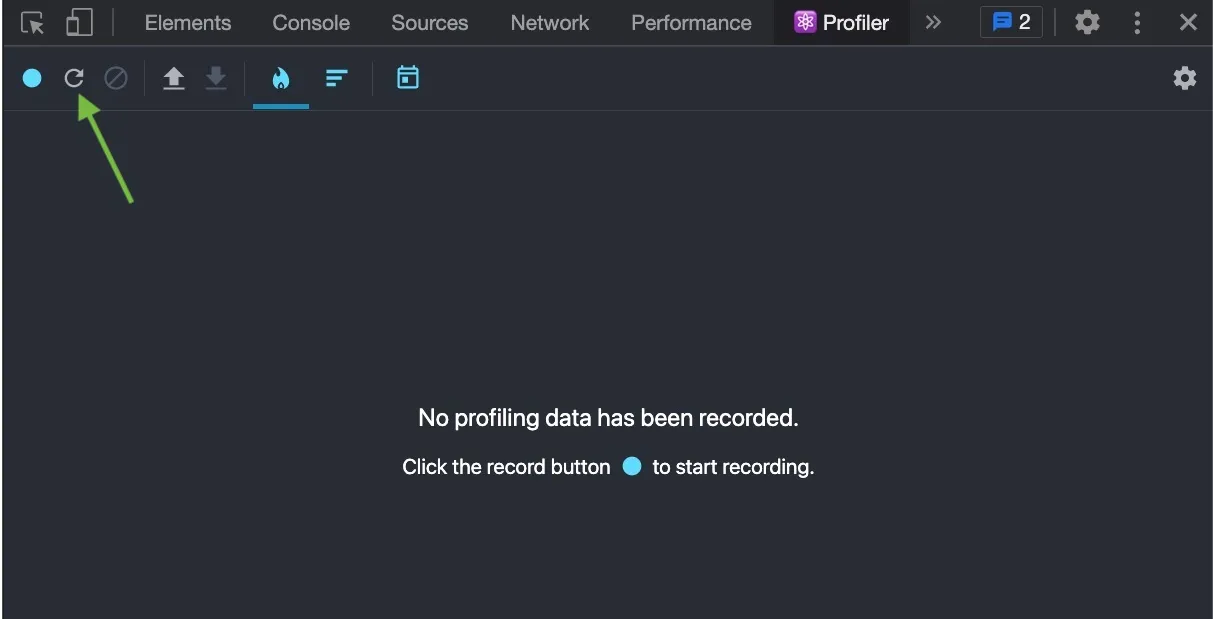
After the recording started, play with your app a bit or reproduce a particularly problematic scenario and then stop the recording:
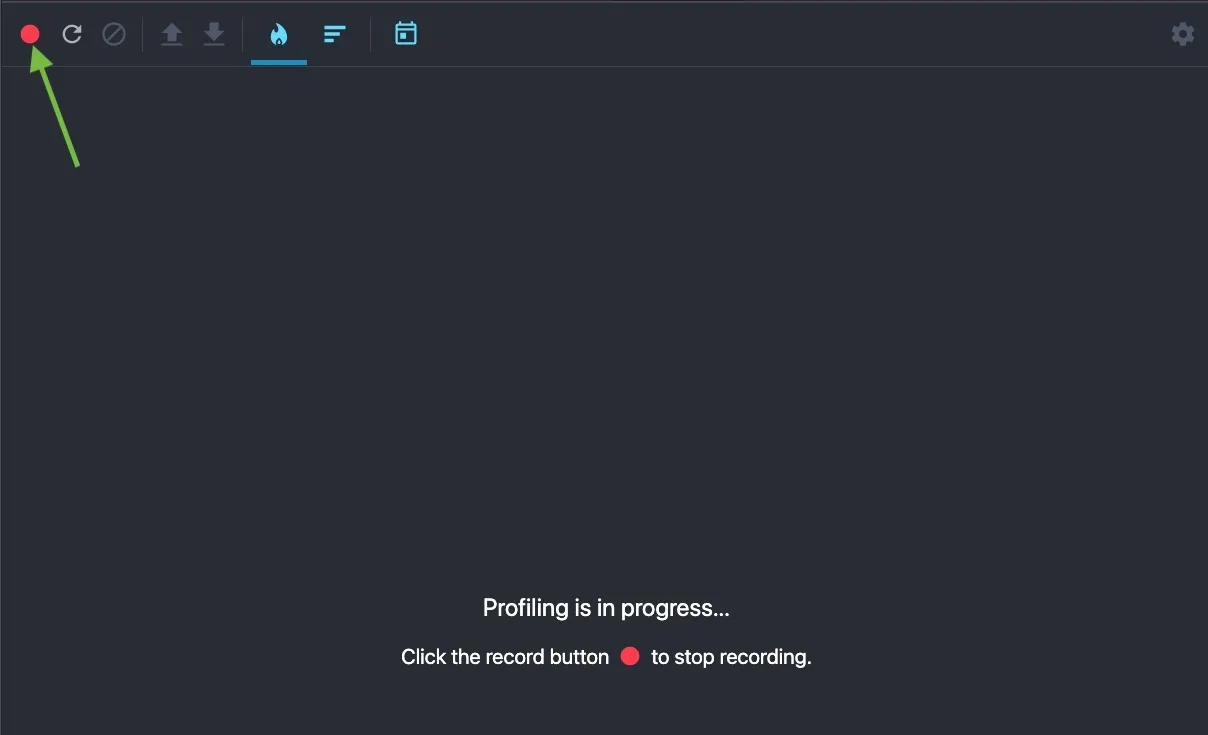
For our test app I'll just enter **111** in the text field and then delete the digits one by one (**111 -> 11 -> 1 -> ''**).
After stopping the recording this is what we get:
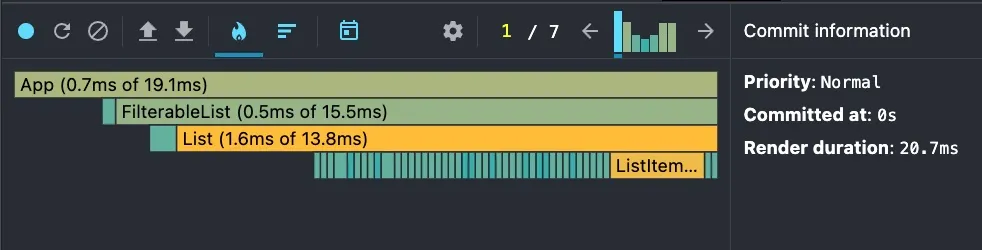
Now let's see what it means.
## Profiler UI
The Profiler UI can be logically separated into 4 main sections:
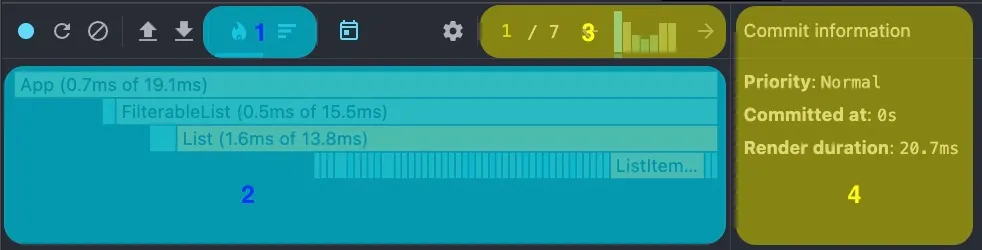
1. **Chart selection** - allows you to choose between two different representations of your app profile - *Flame Chart* and *Ranked Chart*. We'll cover both in detail.
2. **Chart area** - a graphical representation of a *single commit* in your application profile.
3. **Commits** - each bar represents a single occurrence of the [commit phase](https://wavez.github.io/react-hooks-lifecycle/) in the lifecycle of your application. Whenever you select a commit by clicking on it, the chart area and the commit information are updated accordingly.
4. **Information panel** - the details about a single selected commit phase or a single selected component.
Now let's talk about it in detail.
### Commits
React reconciliation algorithm is split into two phases: **render** and **commit**.
- The **render** phase determines what changes need to be made to e.g. the DOM. During this phase, React calls render and then compares the result to the previous render ([the diffing algorithm](https://legacy.reactjs.org/docs/reconciliation.html#the-diffing-algorithm)).
- The **commit** phase is when React applies any changes. (In the case of React DOM, this is when React inserts, updates, and removes DOM nodes.)
[Here](https://web.archive.org/web/20221229101506/https://pbs.twimg.com/media/DZ-97vzW4AAbcZj?format=jpg\&name=large) is the phases diagram for classic React components (by Dan Abramov) and [here](https://wavez.github.io/react-hooks-lifecycle/) is the similar diagram for hooks (by Guy Margalit).
As previously mentioned, each bar in the commits section represents a single commit - the taller the bar the longer the commit took to render. The commits are also distinguishable by a greenish-to-yellowish color gradient - yellow are the less performant ones and green are the more performant.
Thus, a *taller yellow bar represents a commit that took longer than a shorter green bar*.
The currently selected commit is colored blue.
### Charts: Flamegraph Chart
The flamegraph chart view represents the rendering tree of your application for a specific commit. Each bar in the chart represents a React component. The components are organized from the rendering root to the leaves (root is the topmost component and leaves are the bottommost).

As you can see, **Header** and **FilterableList** are **App**'s children so they appear next to each other and below the **App** component.
The width of the bar represents how long the component *and its children* took to render. The color of the bar represents how long the component itself took to render (greenish is fast, yellowish is slow).
Thus, in the example above the width of **FilterableList** represents the time that took **FilterableList** to render *including* the time it took **List** to render.
On the other hand, you can see that **FilterableList** is green and **List** is yellow and it actually correlates with the numbers - it took **FilterableList** only **0.5ms** to render and it took **List 1.6ms** to render.
But what happens if a component is not rendered at all during a particular commit?
Let's take a look at the 4th commit:

The **App** and **Header** components don't change upon filtering, so they are rendered only once - during the first commit. On the following commits both components are greyed out, however, they still look a bit different. So what's the difference?
**Grey fill** - a component that did not render during this commit but is part of the rendering path (e.g. **App** didn't render but it is a parent of **FilterableList** which did render).
**Grey gradient stripes** - a component that did not render during this commit and also is not part of the rendering path (e.g. **Header** didn't render but it also doesn't have any children that did render)
Also, you might have noticed that the **App** component bar still has a width although it didn't render.
So let's refine the definition a bit.
**The width of a bar represents how much time was spent *when the component last rendered* and the color represents how much time was spent *as part of the current commit*.**
Last but not least, you can zoom in or out on a chart by clicking on a component.
Zoomed out:

Zoomed in:

Zoomed out:

### Charts: Ranked Chart
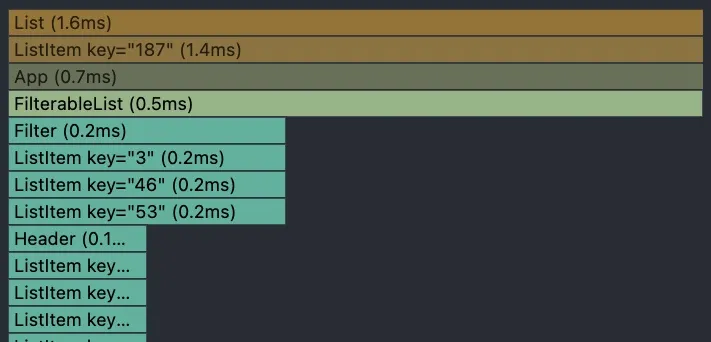
Similarly to a flamegraph chart, a ranked chart represents a single commit. However, unlike in a flamegraph chart, the components are ordered by rendering time and not by rendering order.
That means that *components which took the longest to render are at the top.*
Another difference is that the component's bar width represents the time that it took the component to render *not including its children.* Which means there is a direct correlation between the color and the width.
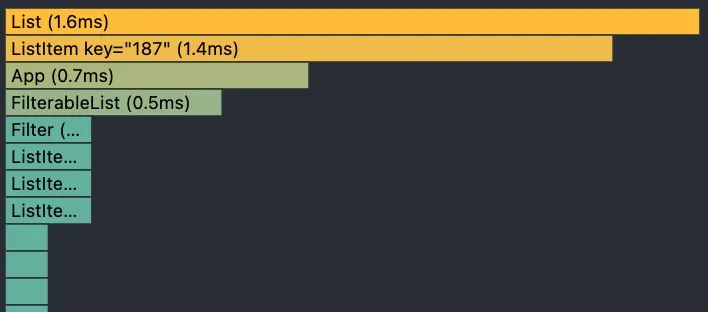
As you can see, **List** took the longest to render so it is located at the top, it is the widest among the bars and it is the yellowest among the bars.
Components that didn't render during this commit *won't appear in the ranked chart*.
Similarly to the flamegraph chart zoom in and out are possible by clicking on a component.
### Information panel
The information panel has two different applications.
**1. Selected commit**
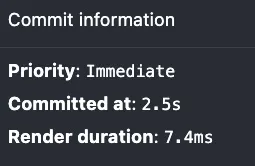
When no component is selected (zoomed in) it shows an overview of a commit that is currently selected in the commits section. The data includes the time (since the app start) it was committed at, the time it took to render and the priority.
**2. Selected component**
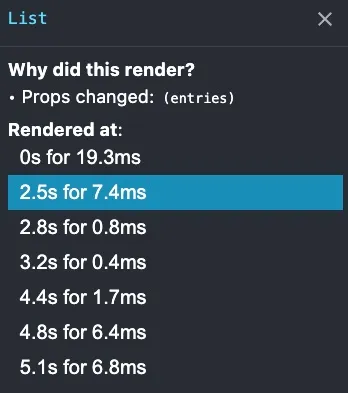
When you click on a component (zoom into it) in one of the chart views, the information panel will show the details about this component. This includes why the component has rendered during this particular commit (if you enabled this option in settings) and the list of commits with timestamps. The list is interactive and allows you easily navigate between different commits in which this particular component has been involved.
## Taking the lab rat to the next level
Now that we're acquainted with React Profiler let's see how we actually apply this knowledge to a real-life scenario.
Let's take another look at our [app](https://github.com/just-jeb/react-profiler-lab-rat-app/tree/not-optimized).
The logic inside the components is pretty straightforward, so it will be hard to improve.
Instead, we'll focus on rendering performance to try and reduce the number of renders. Since all we're doing between the commits is filtering, we'd assume that the items are rendered once and then just removed from the DOM when a filter is applied. Which means that list items shouldn't be rendered twice as we filter. However, this is not happening. If you look at the [lab rat](https://react-profiler-lab-rat.netlify.app/) profile and switch between the commits in the commits panel, you'll notice that the list items are rendered upon every commit. Why is this happening?
Let's zoom into one of the items in the second commit and try to figure it out.
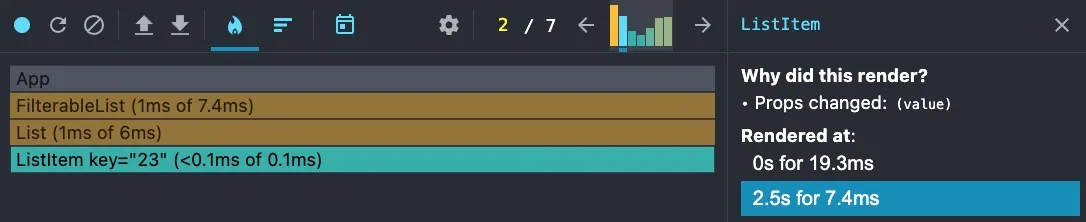
Zooming in provides us with helpful information - the item has been re-rendered since its **value** prop has changed (see the **Information Panel**).
Why would the value change? Well, every time we filter the list a new array is created. Since we're using item index as a **key** for **ListItem** components, the distribution of list values among the components will be different every time we change the filter value.
For example, at the first render the first entry in the array was rendered using a component with **key=1**. However, on the second render when we filtered out a few values from the array, the first entry might be different. React will reuse the component with **key=1** from the first render, but the value has changed because the first entry has changed, hence re-render.
To fix this behavior we'll assign an **ID** to every entry in the array when we first create it and use it as a key for the item instead of using item index.
Let's apply the fix and see what's changed (the updated app is available [here](https://react-profiler-lab-rat-semi-optimized.netlify.app/)):
```tsx
const items = Array.from({ length: 200 }, (_, index) => ({ value: `${chance.integer()}`, id: index}));
export const FilterableList = () => {
const [searchTerm, setSearchTerm] = useState('');
return
item.value.includes(searchTerm))} />
}
```
Surprisingly it changed nothing - the numbers are the same and the item components are still re-rendered upon every commit. Let's take a closer look:
[Interactive figure: open it on the page](https://www.justjeb.com/post/react-profiler)

As you can see there is one thing that did change - the reason for a re-render. Now the **ListItem**s are re-rendered because their parent component (**List**) is re-rendered, even though nothing changes for these components - neither the ID nor the value.
Luckily we know how to solve this kind of issues - [**React.memo**](https://react.dev/reference/react/memo)!
Let's put **memo** on the list items and see how much it improves:
```tsx
export const ListItem: FC = memo(({value}) => {value}
)
```
[Here](https://react-profiler-lab-rat-optimized.netlify.app/) we go!

None of the previously rendered items are re-rendered on the following commits. And look at the render duration: the second commit took 7.2ms after the key fix and 3.1ms with memo, so we cut it by more than half.
[Interactive figure: open it on the page](https://www.justjeb.com/post/react-profiler)
## Finishing words
Obviously the ultimate solution to this performance problem would be using a list with virtual scroll which would reuse the same items for different data and thus save on re-mounting the components. However, the goal of this article is to learn how to use the profiler and not to provide the best solution for the Lab Rat app. So I hope this goal is achieved and you understand how it works and what it is capable of.
Feel free to play around with the Lab Rat live application or fork the Github repo and play with it locally:
- **Non-optimized**: [Github](https://github.com/just-jeb/react-profiler-lab-rat-app/tree/not-optimized), [Live](https://react-profiler-lab-rat.netlify.app/)
- **Semi-optimized**: [Github](https://github.com/just-jeb/react-profiler-lab-rat-app/tree/semi-optimized), [Live](https://react-profiler-lab-rat-semi-optimized.netlify.app/)
- **Optimized**: [Github](https://github.com/just-jeb/react-profiler-lab-rat-app), [Live](https://react-profiler-lab-rat-optimized.netlify.app/)
**Important note:** React DOM automatically supports profiling in development mode for v16.5+, but since profiling adds some small additional overhead it is opt-in for production mode. [This](https://react.dev/reference/dev-tools/react-performance-tracks#using-profiling-builds) explains how to opt-in.